Reporting
You can access reporting from the left-hand sidebar of the Insights area of your Plain workspace.

Key metrics
Plain gives you visibility into the following core metrics – and more:
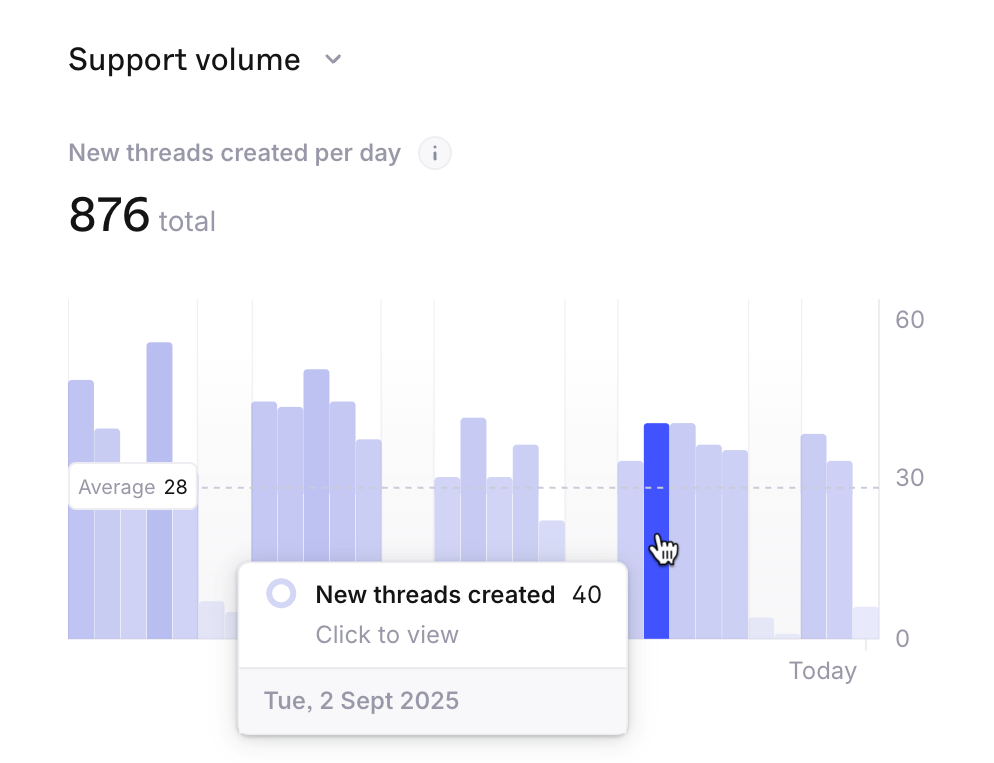
Support volume – The number of threads in your queue over time
First response time – How quickly customers receive their first reply
Resolution time – How long it takes to fully resolve a request
Customer waiting time – How long customers are waiting between replies
Each metric includes:
Median and 90th percentile values
Time ranges: Today, Last 7 days, Last 28 days
Trends: See whether metrics are moving up or down
Breakdown by Company, Tier, Label, and more
Dig into the details
For each metric, you can drill down by: Channel, Company, Group, Label, Priority, and Tier.
This helps you pinpoint where volume is rising, where SLAs are slipping, or which parts of your support funnel need attention.

In selected charts, you can also click into individual data points in the chart to view the exact list of threads representing that data point. For example, clicking on a bar in the bar chart for new threads created per day will show you a list of the threads created for that time range:
Inline reporting, everywhere
Hover over any Company, Group, Label, or Tier anywhere in Plain to see recent support volume at a glance. It’s a quick way to catch emerging patterns and adjust your triage or workflows in real time.

Need custom data?
If you’d like to see metrics beyond what’s shown in Plain’s reporting dashboard – or if you want to export the data to a BI tool – reach out to us at help@plain.com.
We’d be happy to help you extend your reporting setup.